


The automatic analysis of man-made objects in remotely sensed images
is a challenging task. In the framework of structural analysis of complex
scenes a blackboard-based production system (BPI) is used at FGAN-FOM
[5]. In this system transformations of the simple
objects extracted from SAR (synthetic aperture radar) images into more
complex objects are given by productions (e.g. edges  lines long-lines parallel-lines
runways). A production net proceeds stepwise according to
a model and produces intermediate results with an increasing degree of
abstraction. Some of these recent approaches are described in
[11, 10].
lines long-lines parallel-lines
runways). A production net proceeds stepwise according to
a model and produces intermediate results with an increasing degree of
abstraction. Some of these recent approaches are described in
[11, 10].
The presented application is based on edge features which are typical
for man-made objects. Fig. 3a shows the result of a
gradient-based edge detection (according to Burns [2]) applied to a SAR image. These edges are the primitive objects
of the considered structural analysis. Fig. 3b shows the
detected runway as a result of the production system. The analysis of
the process for this image shows, that only 20 lines of about
37,000 are used to construct this stripe (see Fig.\
3c). However, the analyzing system has to take all of the
lines into account. Unfortunately, time consumption is typically at
least  . The production process could significantly be sped up
if only the most promising primitive objects are identified and the
analysis is started with them.
. The production process could significantly be sped up
if only the most promising primitive objects are identified and the
analysis is started with them.
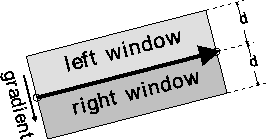
Figure 1: definition of regions next to line
The idea is to extract features from the image that describe the primitive objects and allow a classifier to decide which lines can be discarded. Experiments showed that in the case of line primitives the regions next to the lines bear useful information. Therefore we construct rectangular windows with an orthogonal distance d adjacent to the lines. The gradient across the edge is used to define the line direction and to uniquely distinguish between left and right window (see figure 1). For each window a set of statistical (e.g.\ mean and standard deviation) and textural features (e.g. energy, entropy, etc.) is calculated from the gray values. Altogether 11 features were defined.
For every image the production process is performed on the complete
set of lines. The result is used to divide the lines into those that
were used for the construction of complex structures (the
positive class) and those that were not (the negative class).
A classifier has to take into account the special semantics of the
task. A classifier that simply always predicts the majority class
would have an error rate close to  (i.e. only 20 errors for the
37,000 objects in Fig. 3a), but the result would be
completely useless and would hinder any object recognition. As a matter
of fact, every missed positive can turn out to be very expensive. This has
to be considered in the misclassification costs.
(i.e. only 20 errors for the
37,000 objects in Fig. 3a), but the result would be
completely useless and would hinder any object recognition. As a matter
of fact, every missed positive can turn out to be very expensive. This has
to be considered in the misclassification costs.